Multiverse debugging overview
As we explore your system we generate a ‘multiverse’ of possible execution paths. When a bug is found, Antithesis offers multiverse debugging (MVD) sessions, which enable you to dive in to a moment of interest in this multiverse and perform investigations.
The perfect reproducibility of Antithesis gives you two debugging superpowers: time-travel and destructive analysis.
With time-travel you can pull information from the past, present, or future of a reproduction of your bug. The precision here is extreme. Do you want:
- The last network packet that was sent before your process died?
- The internal state of your Raft algorithm at the moment a leader has been chosen?
- The eventual health-check result of your system after minutes of quiescence?
We’ve got you covered.
With destructive analysis you can interact without fear of losing your reproduction. Do you want:
- To cause a core dump by killing a key process?
- To take down all secondary nodes and see if a suspected race condition still occurs?
- To first choose to step-over in your debugger and later choose to step-into?
Without Antithesis, this kind of destructive analysis could render the current reproduction unusable, forcing you to painstakingly recreate the bug (or worse, wait for it to happen again in prod) each time you want to answer a question.
With Antithesis, you can debug fearlessly, restoring reproductions of heisenbugs in milliseconds.
- For an overview of our core concepts, check out exploring the multiverse.
- For examples of what you can accomplish, check out our cookbook.
Workflow
Step 1: Select a bug to investigate
Pick a bug-example that Antithesis encountered which you would like to investigate further. Usually you’ll select one from your triage report by opening the relevant test property, picking an example of interest, and using the copy moment button.
From this copied text gather the session_id, input_hash, and vtime.
Step 2: Launch a session
Launch a multiverse debugging session using the /launch/debugging webhook endpoint that we provide. You’ll need to provide the parameters antithesis.debugging.session_id, antithesis.debugging.input_hash, and antithesis.debugging.vtime using the information you gathered in Step 1. For example:
curl --fail -u 'USER:PASSWORD' \
-X POST https://<TENANT>.antithesis.com/api/v1/launch/debugging \
-d '{"params": {
        "antithesis.debugging.session_id":"d5d1c9cf0e64b5dd69b00e97b07fe3f4-18-1",
        "antithesis.debugging.input_hash":"-9067336385060865277" ,
        "antithesis.debugging.vtime":"45.334635781589895",
        "antithesis.report.recipients":"YOUR_EMAIL@DOMAIN.com"
    }}'
For more details on webhook authentication and parameters see the endpoint reference
Once you kick off the webhook, you’ll receive an email with a link to access your session ~5-10 minutes later. The precise delay here depends on the vtime provided and on the simulation efficiency of your system.
Once you have the access link, you can move to Step 3 and start debugging. This session will be available for six hours.
If your request is malformed (e.g. an invalid parameter) you’ll receive a non-200 response or a failure email almost immediately.
Using multiverse debugging means direct access to your system under test. For this reason you must set up SSO to use this tool.
Step 3: Debug
Accessing your session will open up an Antithesis Notebook. It looks like this:
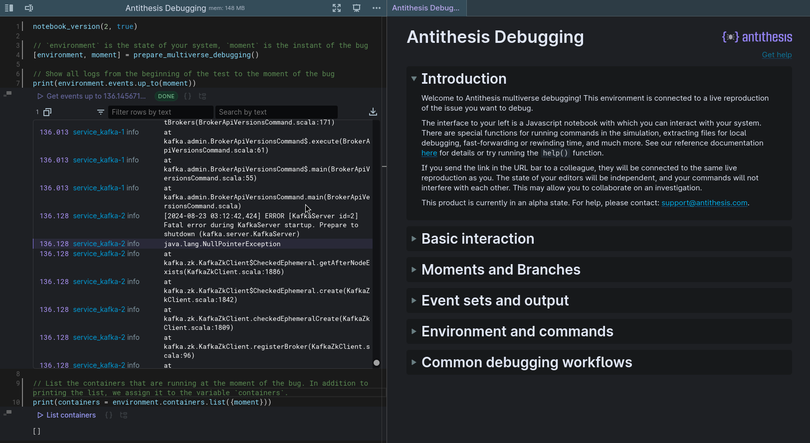
From this notebook you’ll have access to a live reproduction of the bug you’re investigating. You can run commands on your system, undo those commands, rewind and fast-forward time, and branch the multiverse to your heart’s content.
- If you prefer to start with the concepts, check out exploring the multiverse
- If you prefer to learn by example, check out our cookbook or the in-product
help()function.
The starting state of your debugging notebook can be customized to contain the commands you run most often. Email us at support@antithesis.com and we can get this set up for you.
Step 4: Automate
Time-traveling by yourself is cool, but it’s probably better if a machine does it for you.
Any set of debugging steps that you perform in one of your multiverse debugging sessions can be converted into a script that automatically runs in every one of your tests when a certain kind of bug is found. The results, output, artifacts, etc. are automatically attached to your triage report in the bug details section.
Suppose you often want to know what’s happening in your network three seconds before a segmentation fault. Our triage report can autonomously gather this information for you and have it ready when you open the report. Multiverse debugging will still be there for you in the truly hard cases where your scripted steps don’t work.
To get started with custom artifacts, contact us at support@antithesis.com.