
Launching tests
Once you’ve written a test, you’re ready to run it. Antithesis gives you several ways to launch a test:
- from the web app
- with the API
- through your CI
- with the Snouty CLI
Choose a performance tier
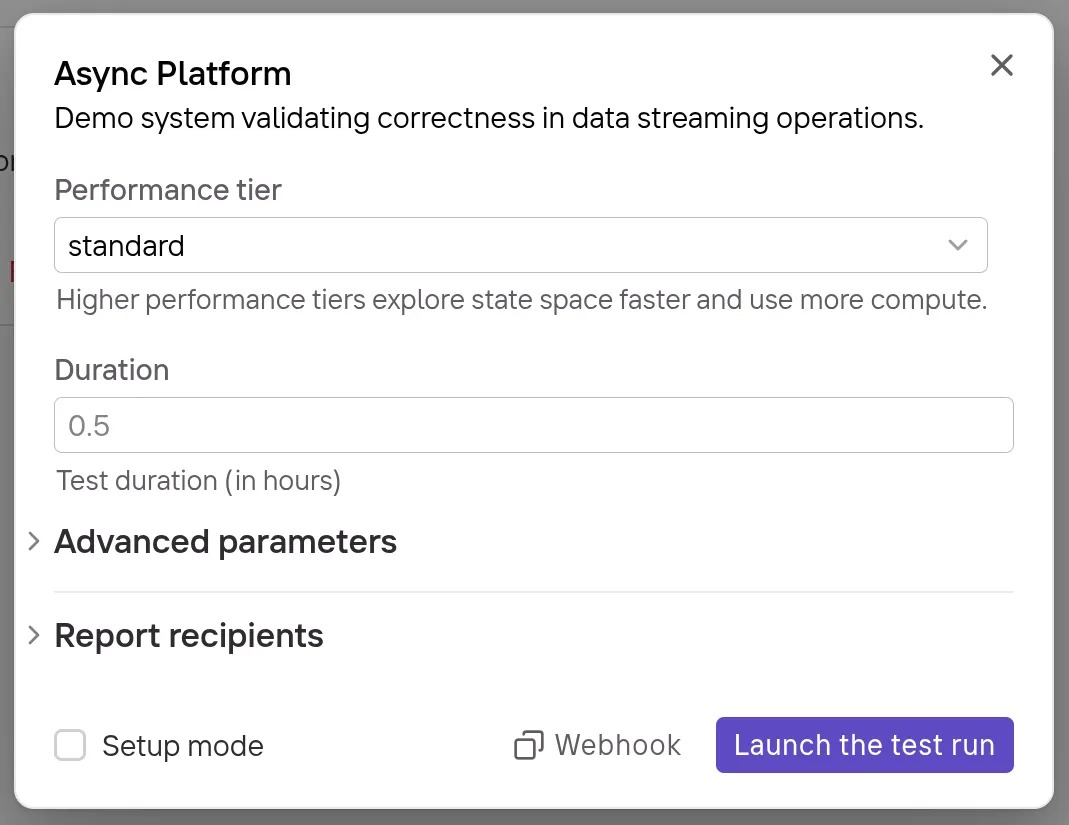
Antithesis lets you choose a performance tier when launching a test run. Higher performance tiers explore system states faster through increased parallelism, and so consume core hours faster. You can track your core hour usage in the web app.
Antithesis provides three performance tiers:
- Standard
- Fast
- Turbo
You can configure the performance tier when you launch a test.
Retroactive logging
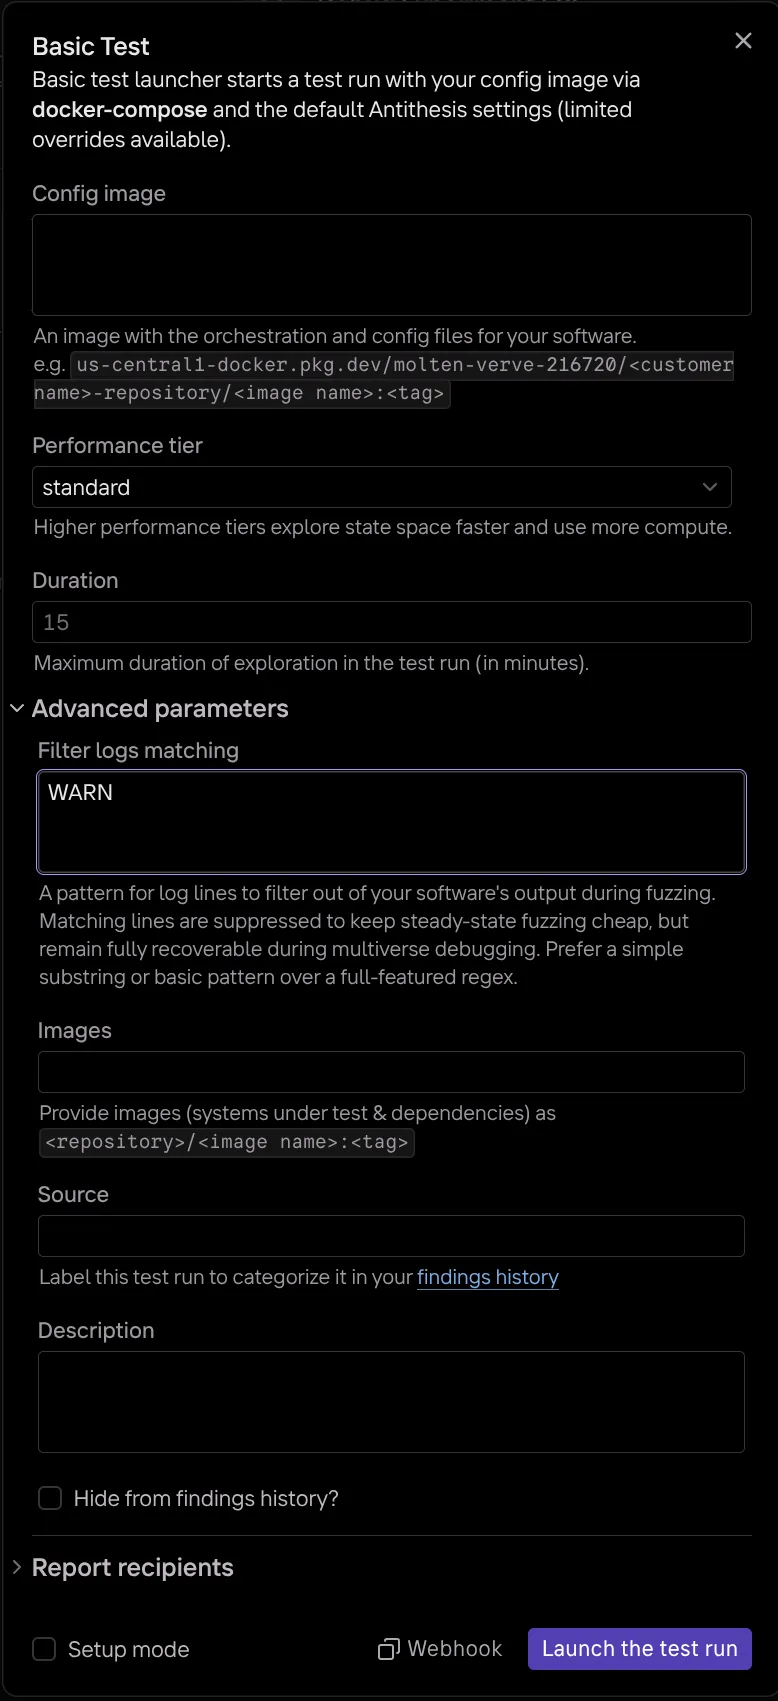
Retroactive logging lets you keep verbose logging on during a test with minimal performance overhead. Log lines matching a pattern you provide are suppressed while Antithesis fuzzes your system, and they remain fully recoverable in a multiverse debugging session.
Use one or both of these methods to select logging output to suppress:
filter_logs_matchingsuppresses individual log lines whose content matches your pattern.filter_source_matchingsuppresses everything from a particular source, which is useful for silencing a chatty component outright rather than picking lines out of it. This method is only available via API or CLI, not the Test Launcher.
Each launch method below details where to set these. Both take an RE2 pattern:
- Matching is unanchored and case-sensitive. Prefix your pattern with
(?i)for case-insensitive matching. - Lookahead, lookbehind and backreferences are not supported.
- Prefer a simple substring or basic pattern over a full-featured regex.
Matching log lines
If your log lines begin with their level, a good starting point is:
(?i)^\s*(TRACE|DEBUG)\bThis suppresses lines whose first non-whitespace token is TRACE or DEBUG, case-insensitive, and leaves your INFO, WARN and ERROR lines untouched.
Anchoring to the start of the line only works if the level is the first thing on it. Structured loggers typically lead with a timestamp, or emit JSON, so match the level field instead:
(?i)"level":"(trace|debug)"Either way, check your pattern against a handful of real log lines from your system before launching a long test. Because matching is unanchored, a loose pattern like error suppresses every line that merely contains that word.
Matching sources
A source is the emitter of a log line, usually the name of the process that wrote it. The source field on each line in your logs shows you the names available to match against. Use them exactly as they appear there, especially if you intend to anchor your pattern.
This pattern is matched against the source name rather than against the line, so a match suppresses that source’s entire output:
metrics-agentMatching is unanchored here too, so that pattern also suppresses a source named metrics-agent-v2. Anchor it with ^ and $ when you want to name a source exactly.
Source matching is set with the antithesis.filter_source_matching parameter through the API, or with --param through the Snouty CLI. It cannot be set in a test launcher dialog.
Launch methods
From the web app
In the web app, the Test launchers tab lets you configure test parameters and launch a test.
Configuring test parameters
Antithesis tests are all configurable using a standard set of parameters. Clicking on a test launcher opens a dialogue box with the available parameters for that test.
The main dialogue includes parameters that you must provide in order to launch the test, such as test duration, performance tier, and your config image. Optional parameters are hidden in fold-down menus. All parameters come with sensible default values pre-filled where possible.
To check your setup before running a full test, check the Setup mode option.
If you’d like to receive the triage report by email, make sure to specify a report recipient — the report is always accessible in the web app.
To suppress verbose logs, set a pattern under Advanced parameters, in Filter logs matching.
If you’d rather run a webhook, you can configure a test in the launcher, then select Webhook to copy the webhook curl command with one click.
Creating new tests
Every Antithesis tenant comes with several pre-written tests.
New tests can be added to customize elements like the hostility of the test environment, which containers are exposed to faults, or the types of faults injected.
Your Antithesis team can help you with this process. Please contact us at support@antithesis.com or ask on our Discord.
Once the test is created, you’ll be able to configure and launch it with a test launcher.
With the API
The Launch a test run endpoint lets you configure test parameters and start a test run programmatically. To suppress verbose logs, set your pattern on the antithesis.filter_logs_matching or antithesis.filter_source_matching parameter.
curl -X POST \ "https://<tenant>.antithesis.com/api/v1/launch/<launcher_name>" \ -H "Authorization: Bearer $ANTITHESIS_API_KEY" \ -H "Content-Type: application/json" \ -d '{ "params": { "antithesis.description": "nightly test run", "antithesis.duration": "30", "antithesis.filter_logs_matching": "(?i)^\\s*(TRACE|DEBUG)\\b" } }'Through your CI
Antithesis integrates natively with GitHub Actions through the Antithesis Trigger Action. You can easily trigger a test run through your workflow and have the results reported back natively in GitHub. Follow the README to set it up.
With Snouty CLI
Install Snouty CLI, then run snouty launch to push your container images and start a test run. To suppress verbose logs, pass your pattern with --filter-logs-matching:
snouty launch --webhook basic_test --config ./config --duration 30 \ --filter-logs-matching '(?i)^\s*(TRACE|DEBUG)\b'Snouty has no dedicated flag for source matching, so pass that one as a parameter:
snouty launch --webhook basic_test --config ./config --duration 30 \ --param 'antithesis.filter_source_matching=^metrics-agent$'What’s next
Once your test is running, Antithesis will set up your system and explore it for the duration that you configured (minimum 15 minutes). Note that this is minutes of test time — the test run itself will last longer because it also includes set up and build time.
During the test run, you can watch the logs stream in with the logs explorer. Once the run is complete, you can view the triage report summarizing the test results.
See Understand your test results for more ways to explore your test run.