Logs Explorer & multiverse map
Exploring the multiverse
When you test with Antithesis, we run your software on multiple parallel instances to find unexpected behaviors in your code. The Logs Explorer and the multiverse map allow you to visualize and search across all the execution paths explored during the test, empowering you with a deeper understanding of what’s happening in your system under test.
With the Logs Explorer you can:
- Investigate production events in a powerful simulation
- Visualize when and where events occur in a test run
- Improve your testing by identifying gaps
For each simulation hour within the Antithesis environment, Antithesis will provide two hundred (200) megabytes of searchable log storage and container image storage for a customer for six (6) months.
Launching the Logs Explorer
There’s an “Explore Logs” button for every run listed in the recent runs section.
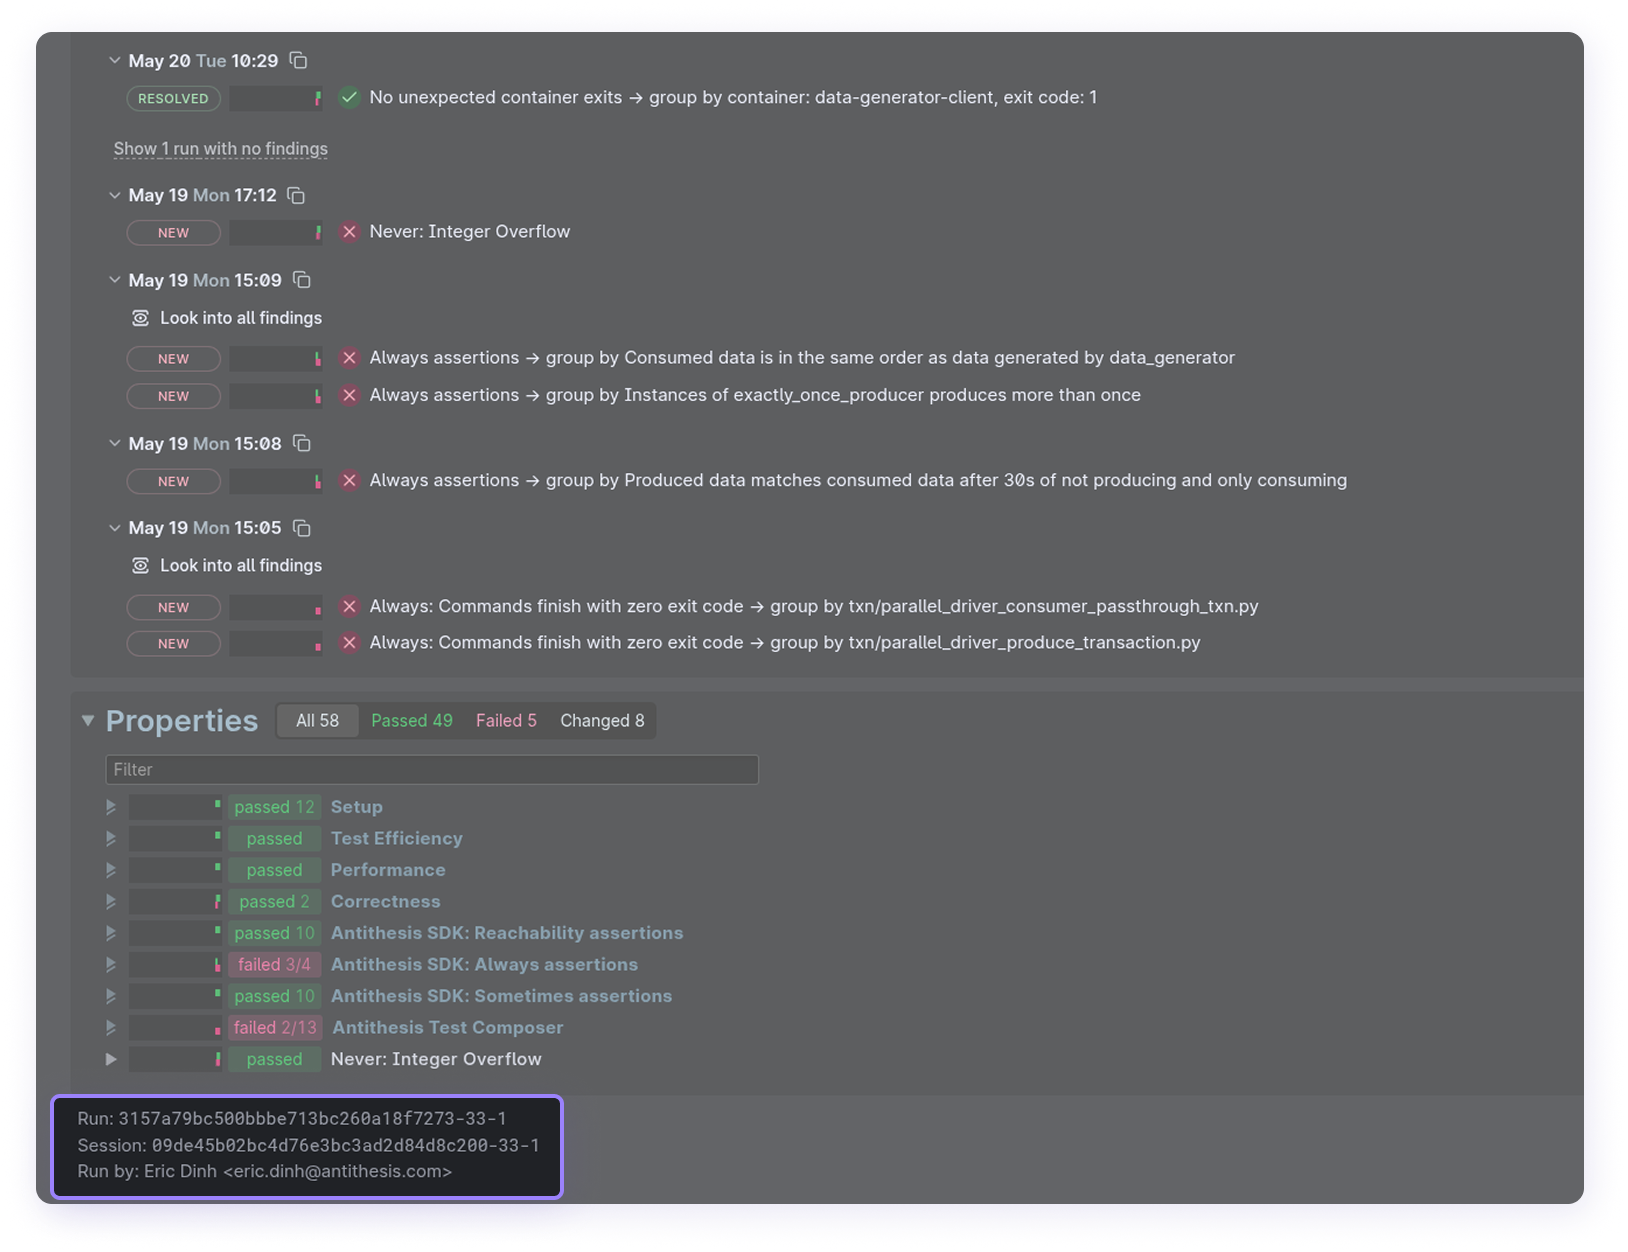
Alternatively, select Logs Explorer from the sidebar, then enter the session ID in the field provided. The session ID is at the bottom of each triage report.
Alternatively, you can click the “Explore Logs” button on a triage report to launch the Logs Explorer for that test run.
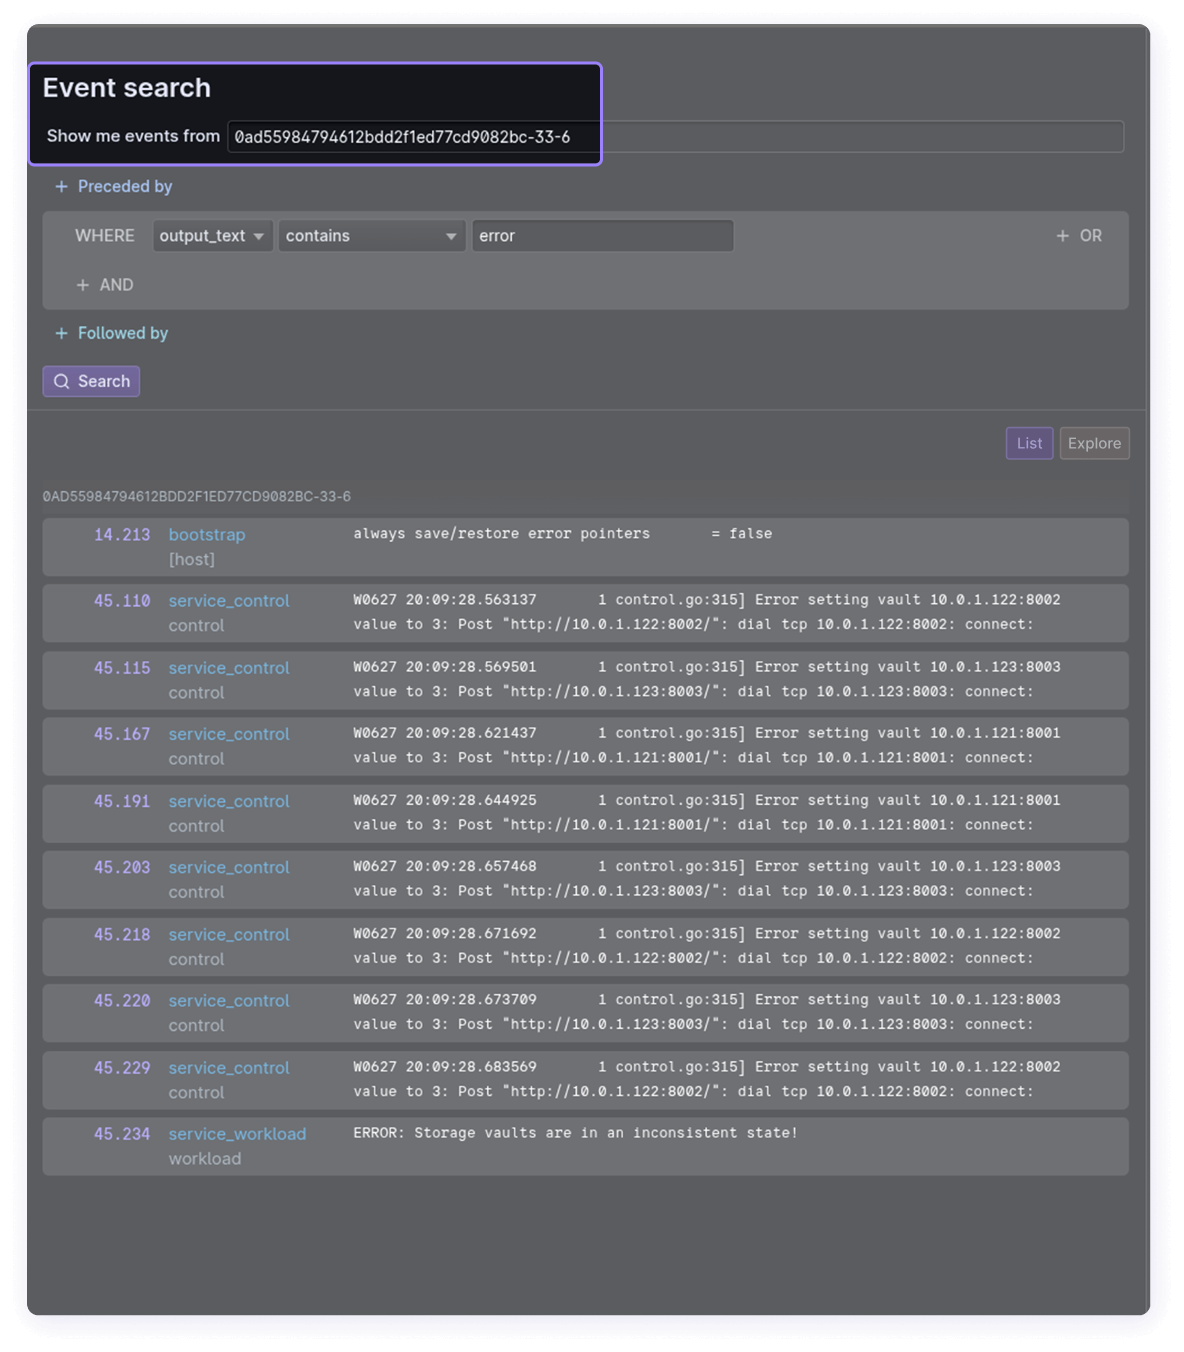
Event search
The Logs Explorer includes a search interface for events and a log viewer. You can:
- Search for any event during a test run: literal text, regular expressions, numbers, or booleans for any fields.
- Search for a set of events using logical search patterns and temporal queries – event X but only when preceded by event Y.
- Remember that events stream in during a test run, so you can search while tests are still running.
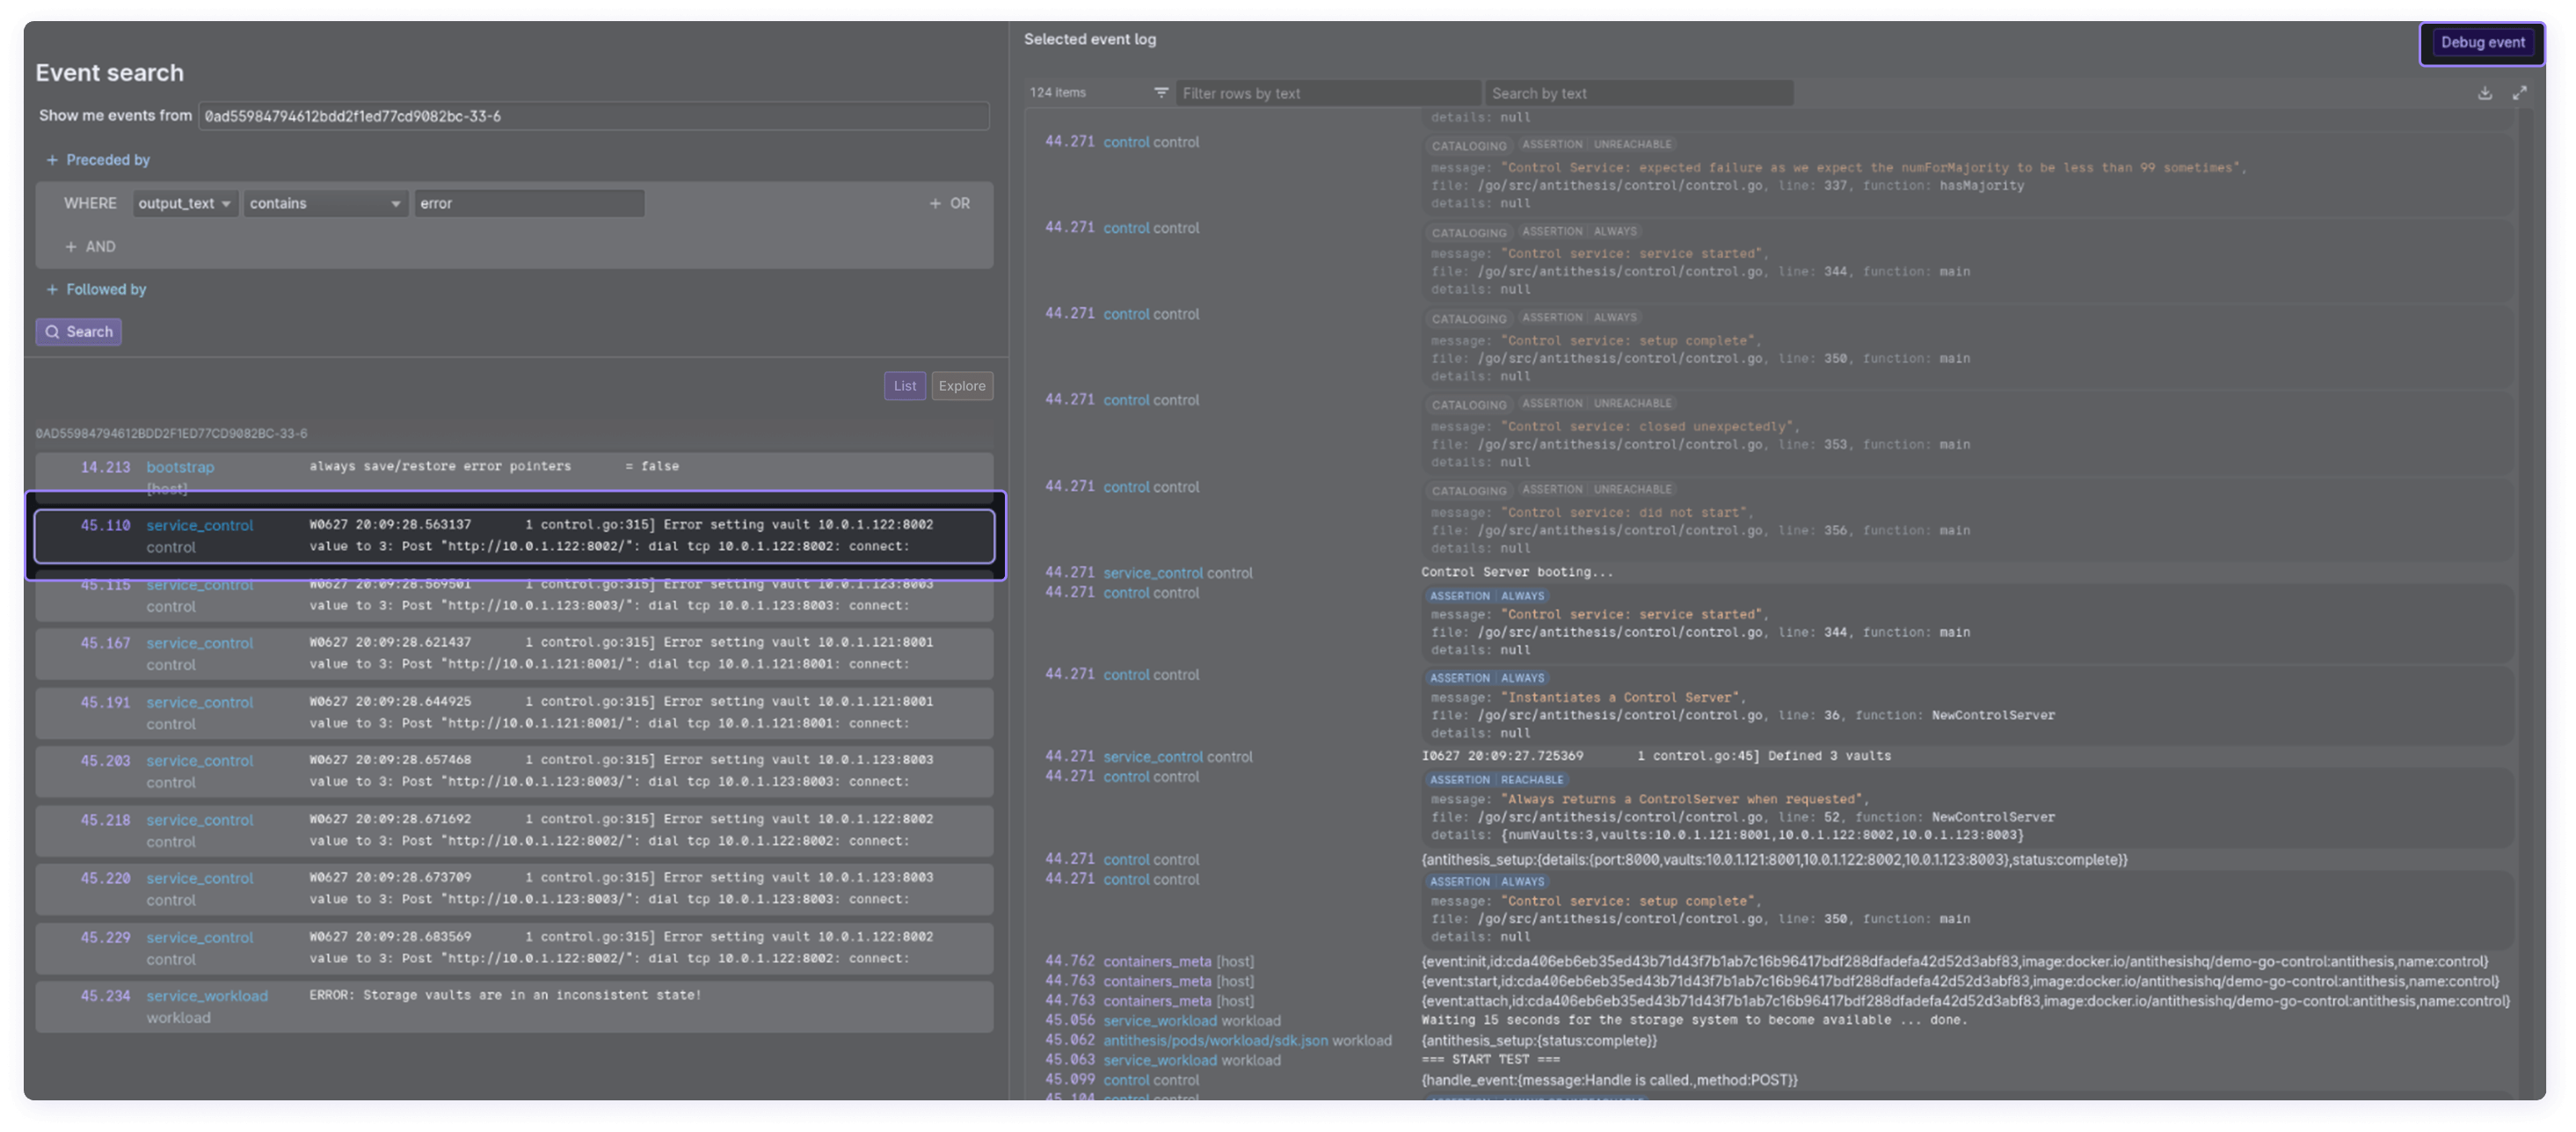
Clicking on any search result will bring up the full log history for that execution path, and you can kick off a multiverse debugging session from the log viewer.
Search performs some convenient type coercions to assist with event matching.
falsematches0and vice versa; same fortrueand1.- Numbers are standardized:
17.0matches17,-.50matches-0.5, etc. - Events missing the field being searched will be ignored, even when using negative operators, e.g.,
not contains.
The multiverse map
The multiverse map is a visualization of a complete Antithesis test run. After starting a search, switch to the Map tab on the event search for this view (you’ll need to click search to make this render). Right click on the map for zoom and view options.
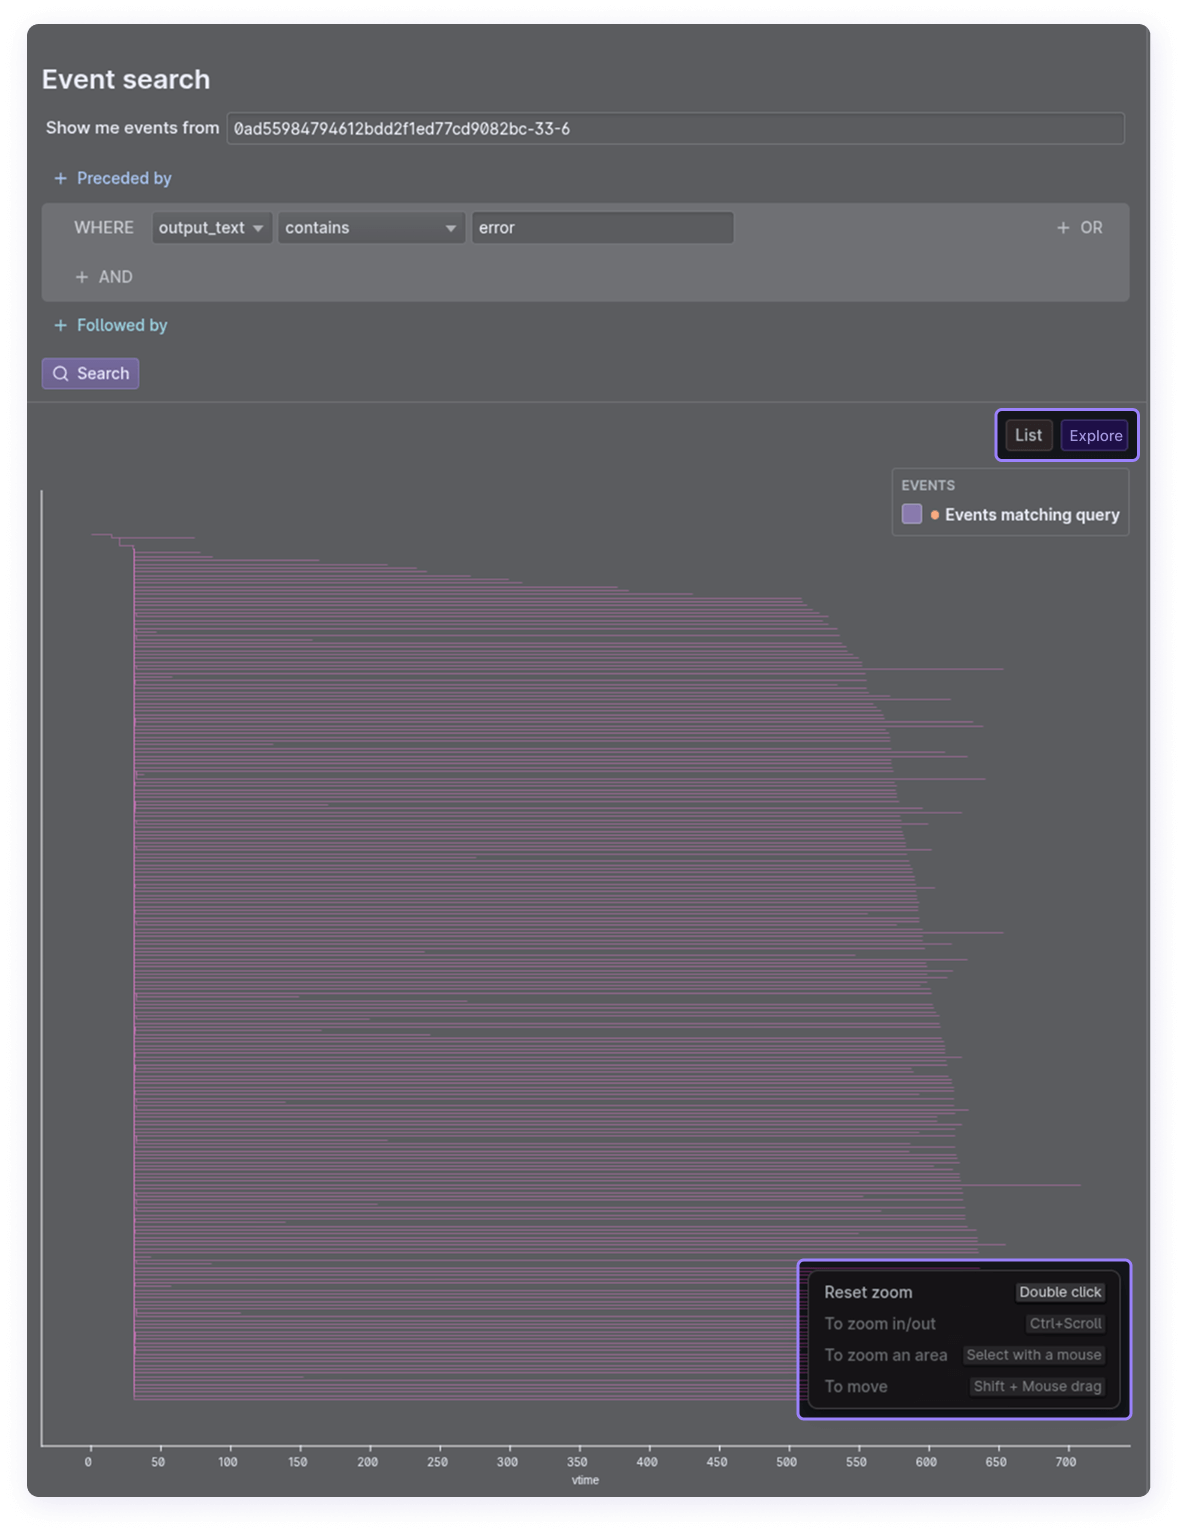
Each branch on this tree is a distinct timeline, in which Antithesis explores a different execution path through your system. This page provides a deeper explanation of the multiverse Antithesis builds in each test run.
Instances of the events you searched for appear as dots.
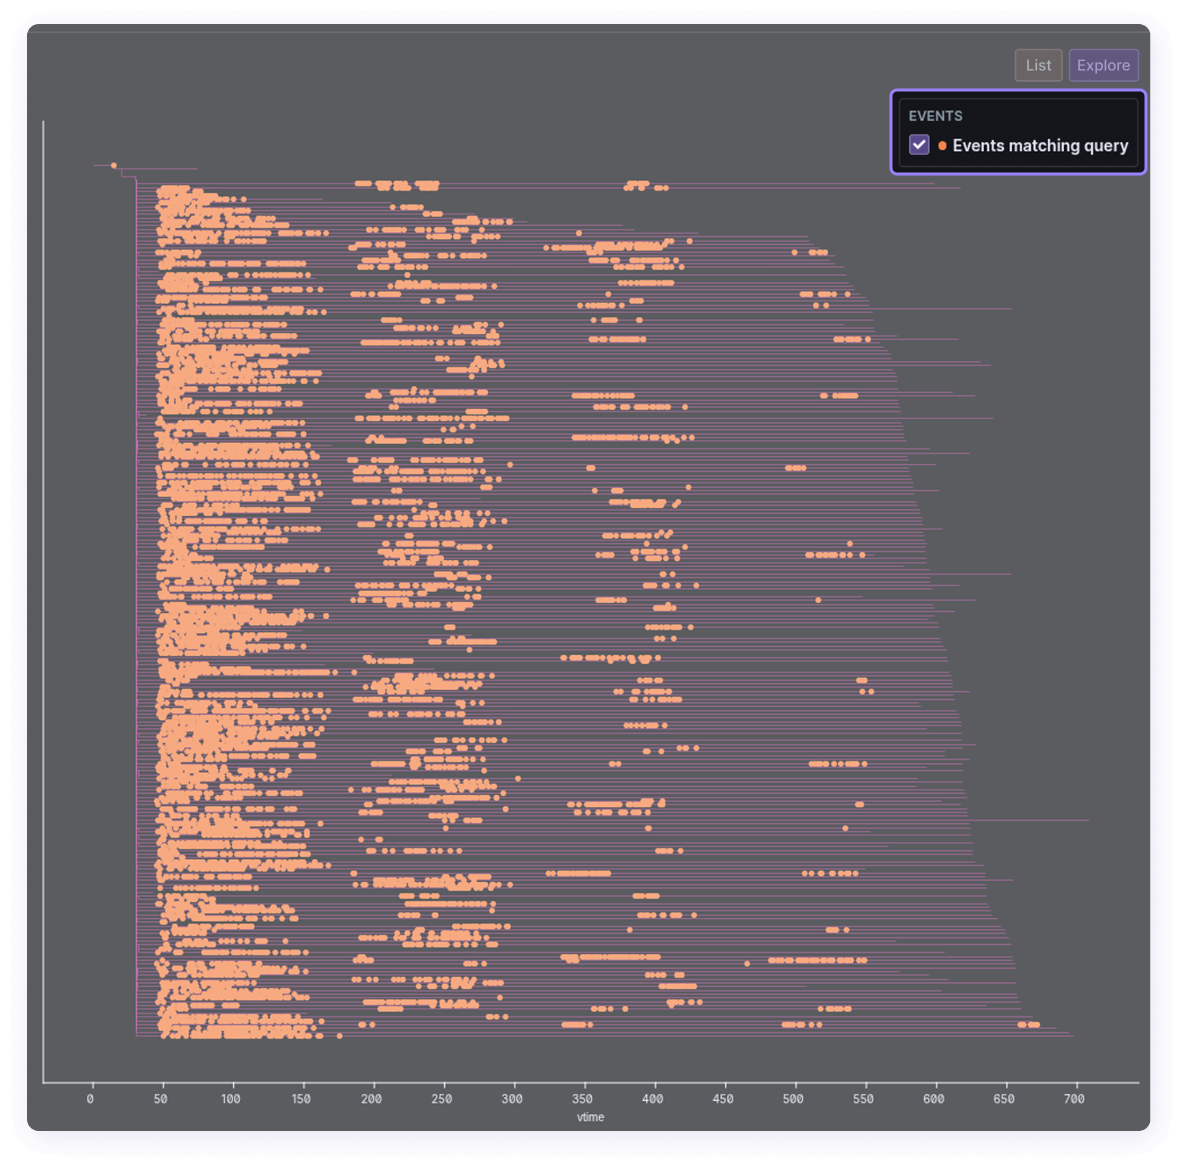
Search for particular events like fault types to understand how frequently they occurred, or search for specific log lines followed by faults to see how often a particular function encounters a fault condition.
Clicking on any dot brings up the corresponding logs.
Common workflows
Investigate something you saw in production
Use case: You saw an ominous log line in production but didn’t have enough information to troubleshoot.
Antithesis runs your software in a simulation that’s much more hostile than production, and does so in massively parallel fashion. Therefore, any rare event you encounter in production very likely appears multiple times in an Antithesis test run, making it easier to investigate and debug.
You can search for any line from your production logs, and layer in additional searches to reveal correlations with other events. Temporal relationships, where event X is PRECEDED_BY event A or event X is NOT PRECEDED_BY event B, can be especially helpful.
To debug further you can launch a multiverse debugging session and replay the bug as it happens in the test run.
You can (and really should) also convert the event to a test property so future test runs will return a finding if it fails – either using our SDKs, or by talking to one of our customer success engineers.
Audit new changes under test
Use case: You want to observe the behavior of some new code changes under test and improve test coverage.
If your new changes are on a feature branch, you can run a one-off test.
Let’s say you want to improve test coverage for leader elections in your database.
Search for leader election events and to see how frequently they happen, and how early or late in the test run.
Say you find leader elections too infrequently in the test run. You click through the leader election event logs and see that the leader election happened when 5 out of 9 nodes are dead.
You can now search for node kill events to see if they’re happening as frequently as you expect. If there are too few node kills, you might need more aggressive faults. If you see a good number of node kills then maybe you need more test scenarios with few nodes, to trigger more leader elections.